
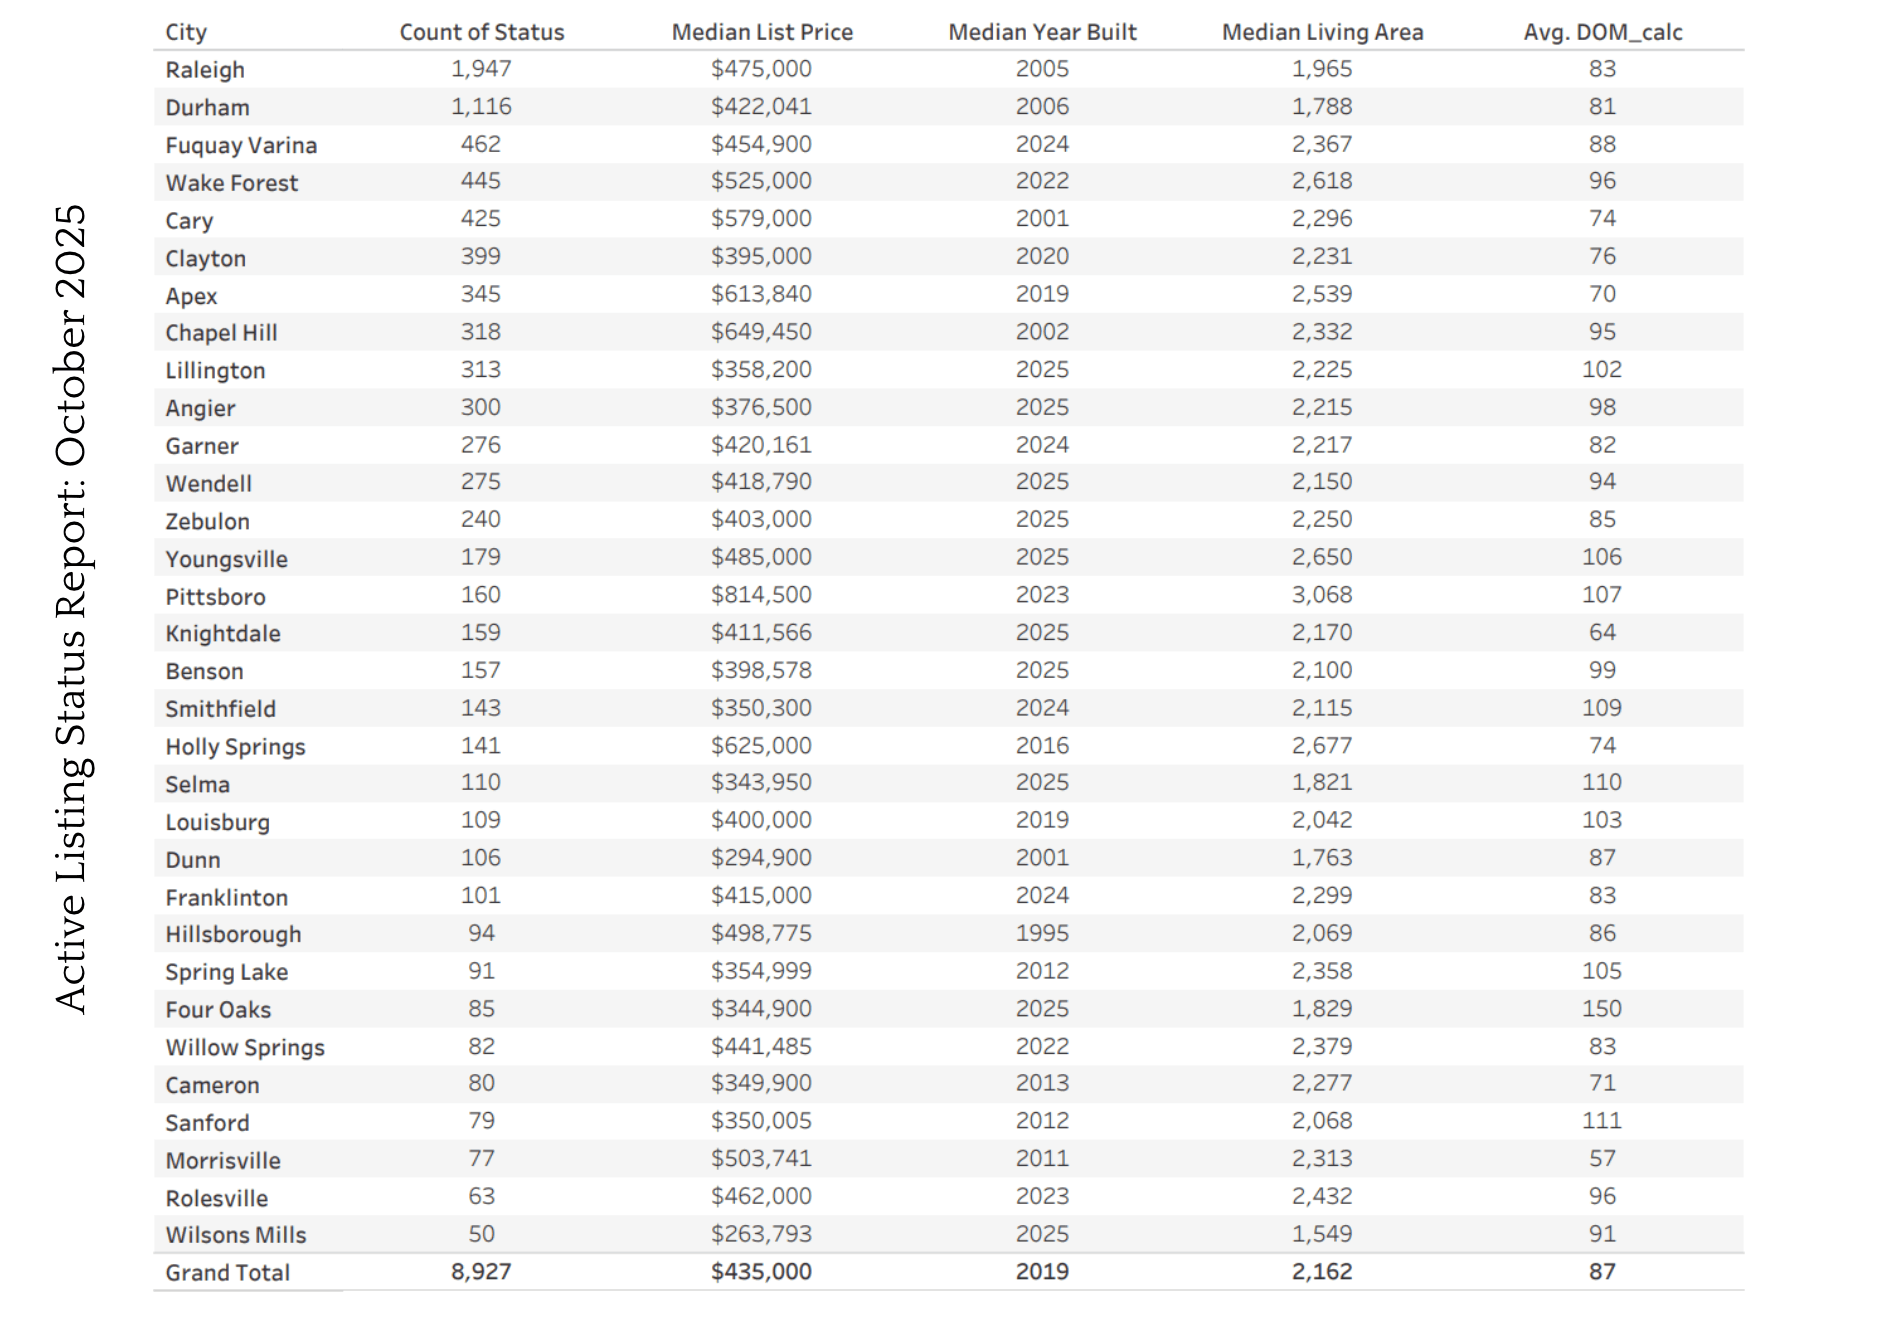
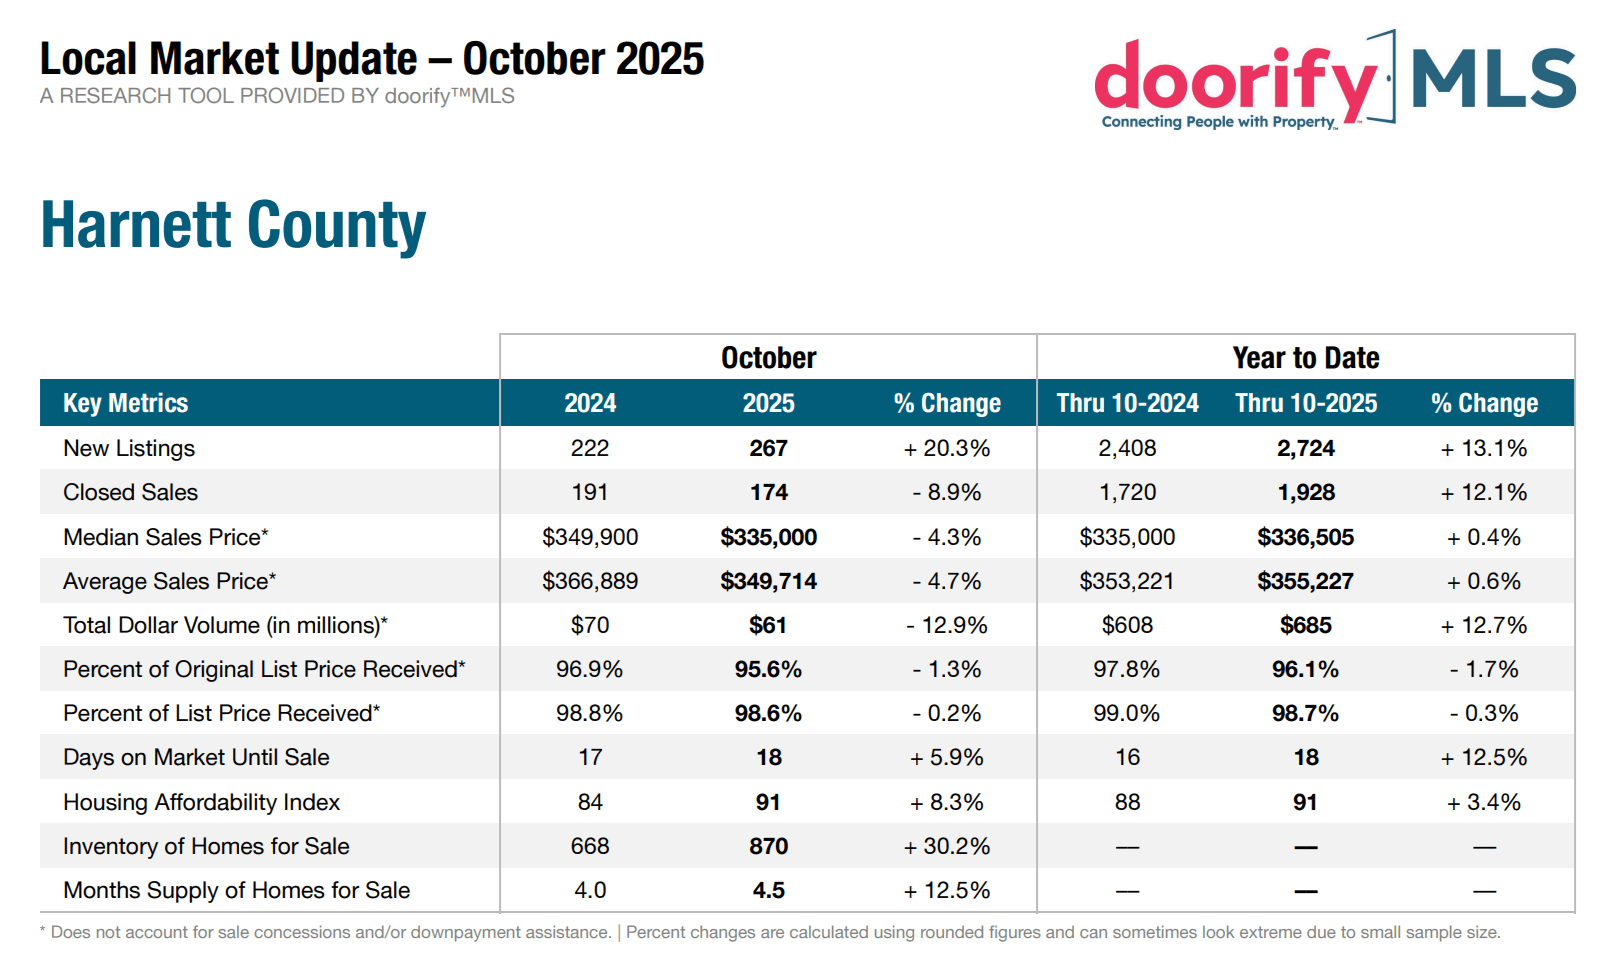
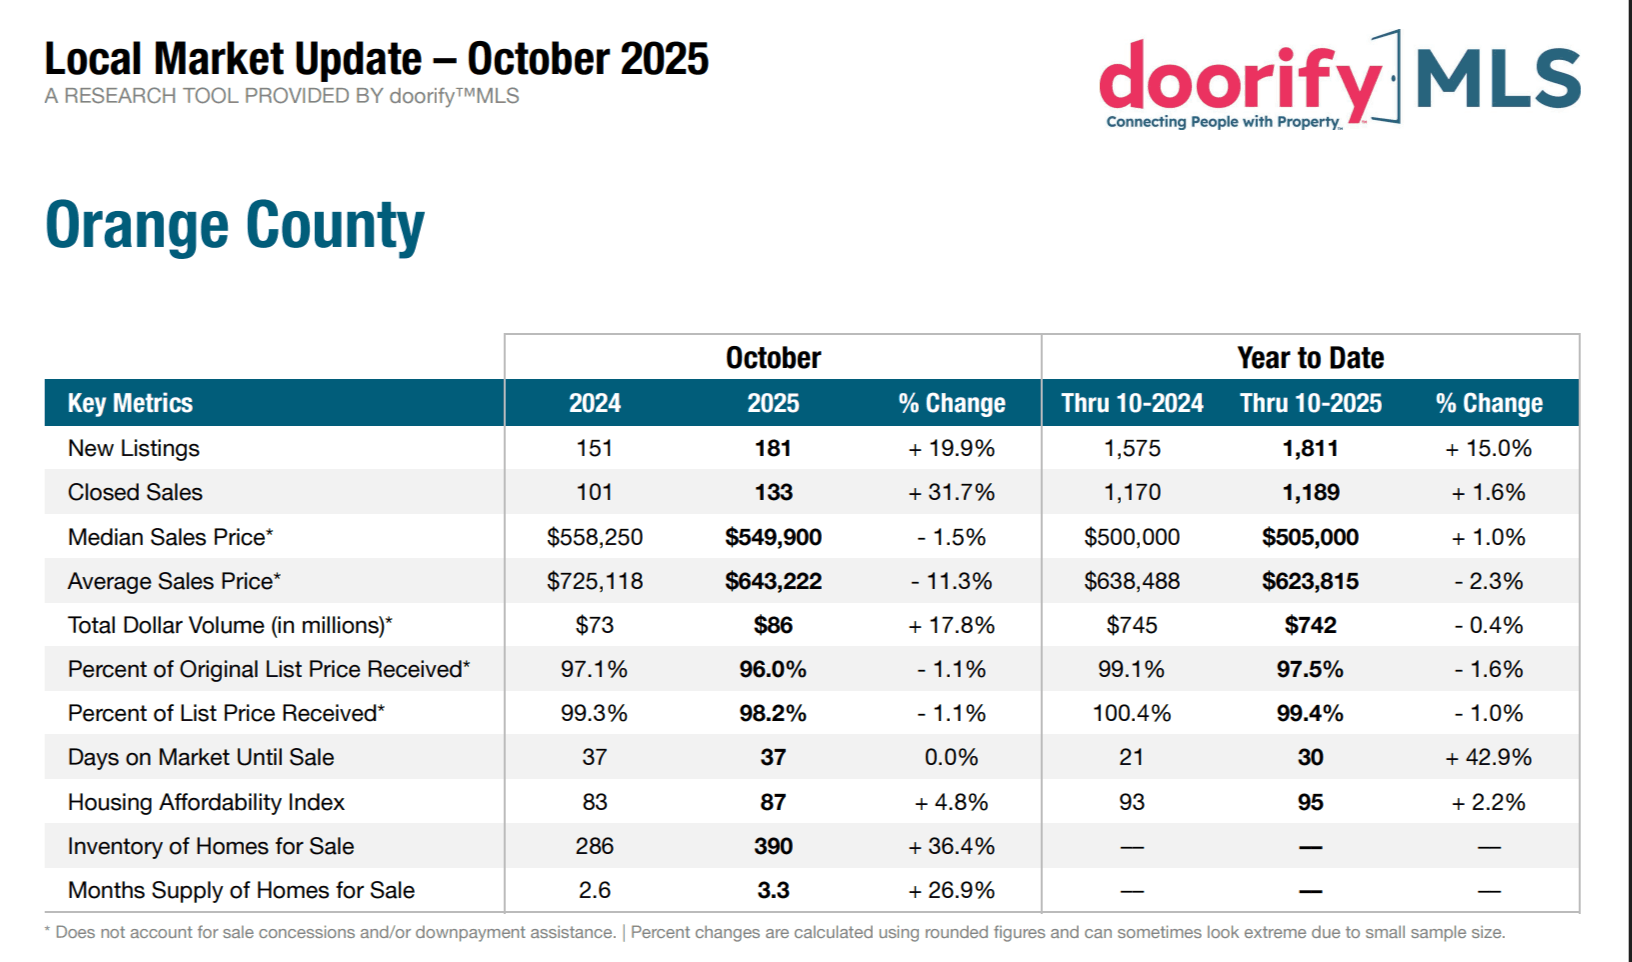
Days on Market: What the Numbers Are Telling Us
Understanding how long homes sit on the market is one of the clearest indicators of shifting leverage between buyers and sellers.
Here’s what the latest data reveals across our region:
Areas With the Shortest Days on Market
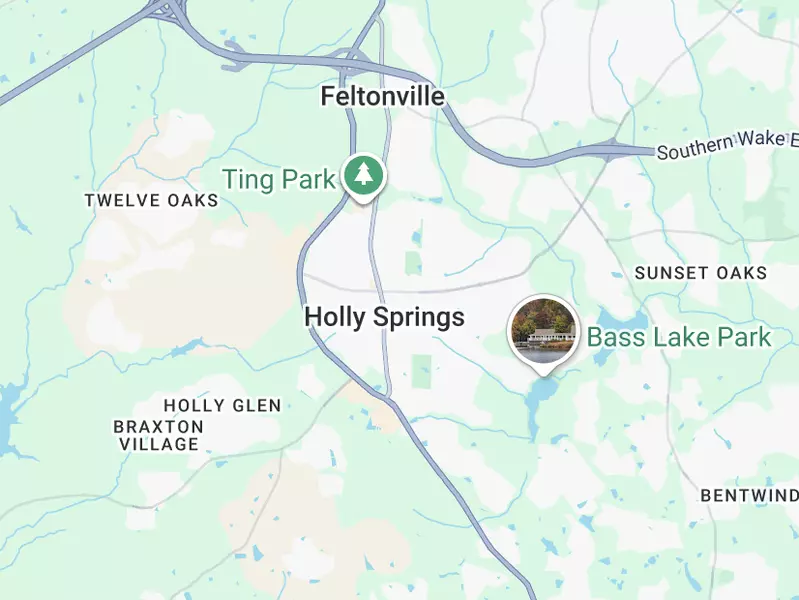
Knightdale (64), Apex (70), and Holly Springs (74) continue to move quickly. These communities remain highly competitive, with well-presented homes attracting strong early interest.
Areas With the Longest Days on Market
Spring Lake (150), Sanford (111), Selma (103), and Zebulon (106) are showing longer market times. This often points to elevated inventory levels or pricing mismatches.
A DOM over 100 frequently signals a shift toward buyer leverage.
What This Means for Sellers
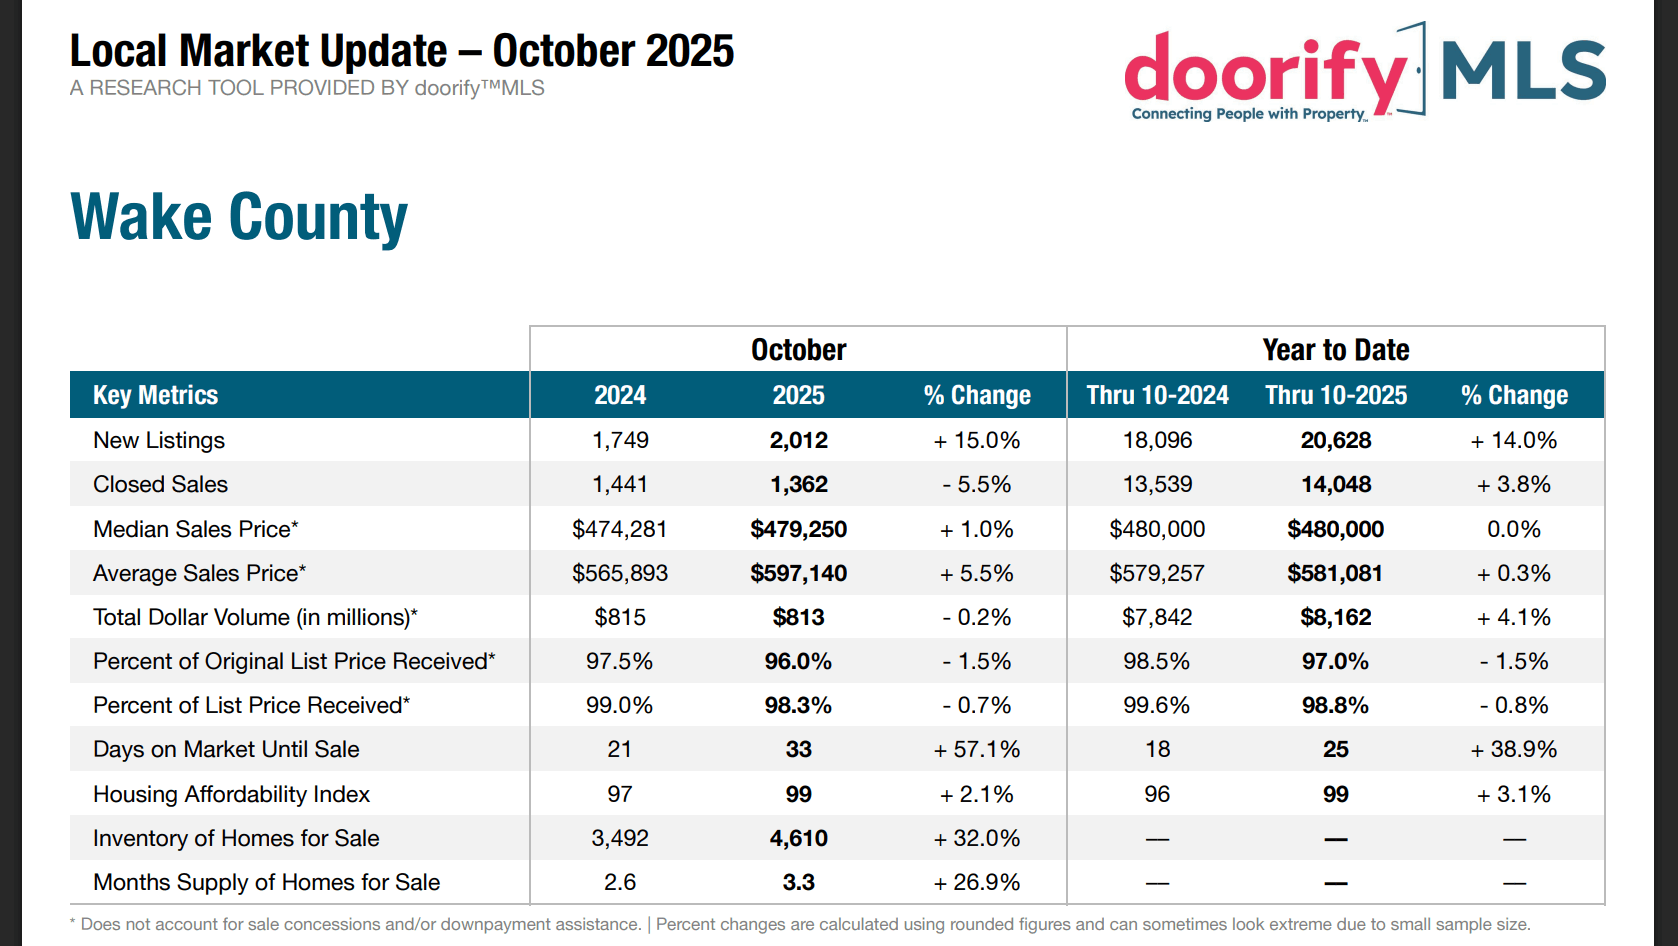
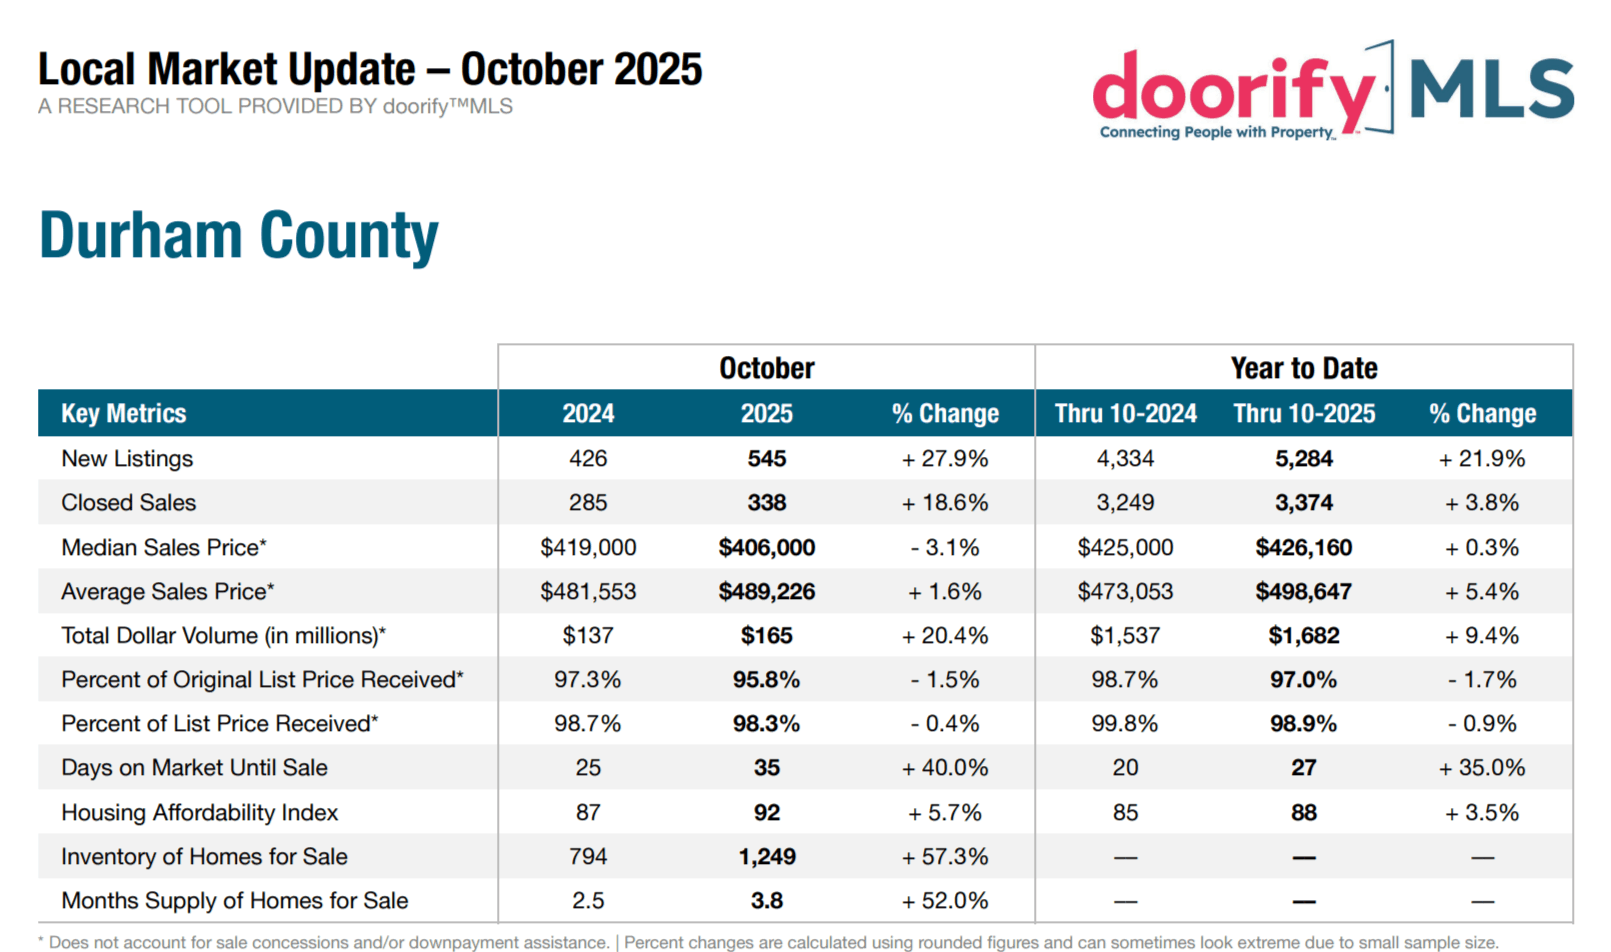
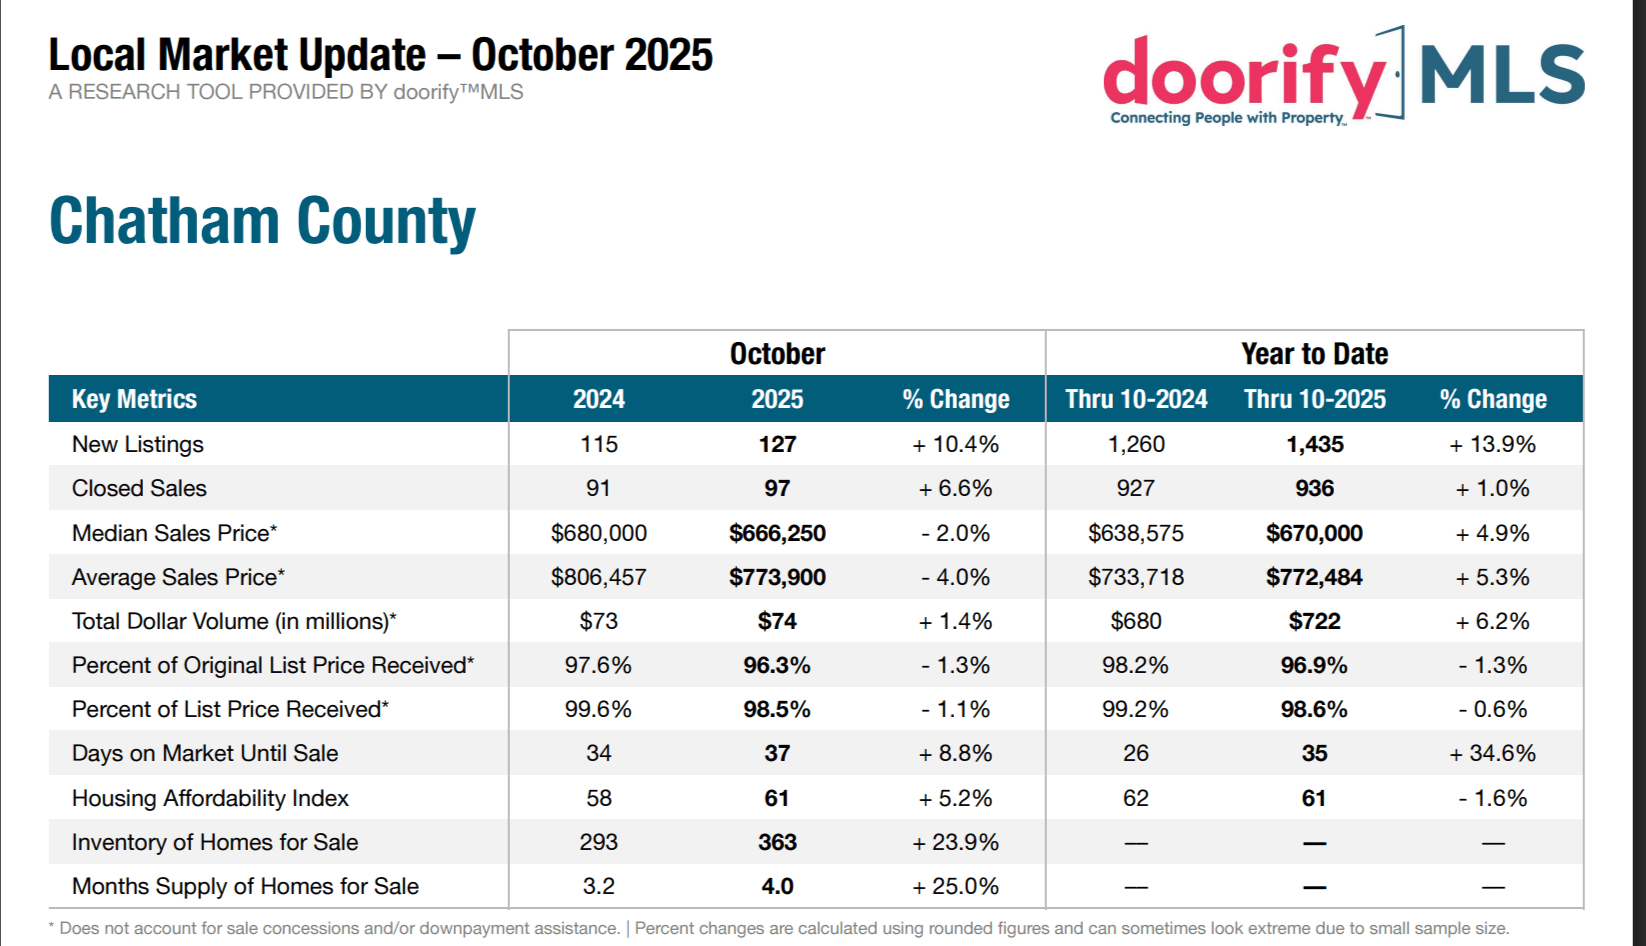
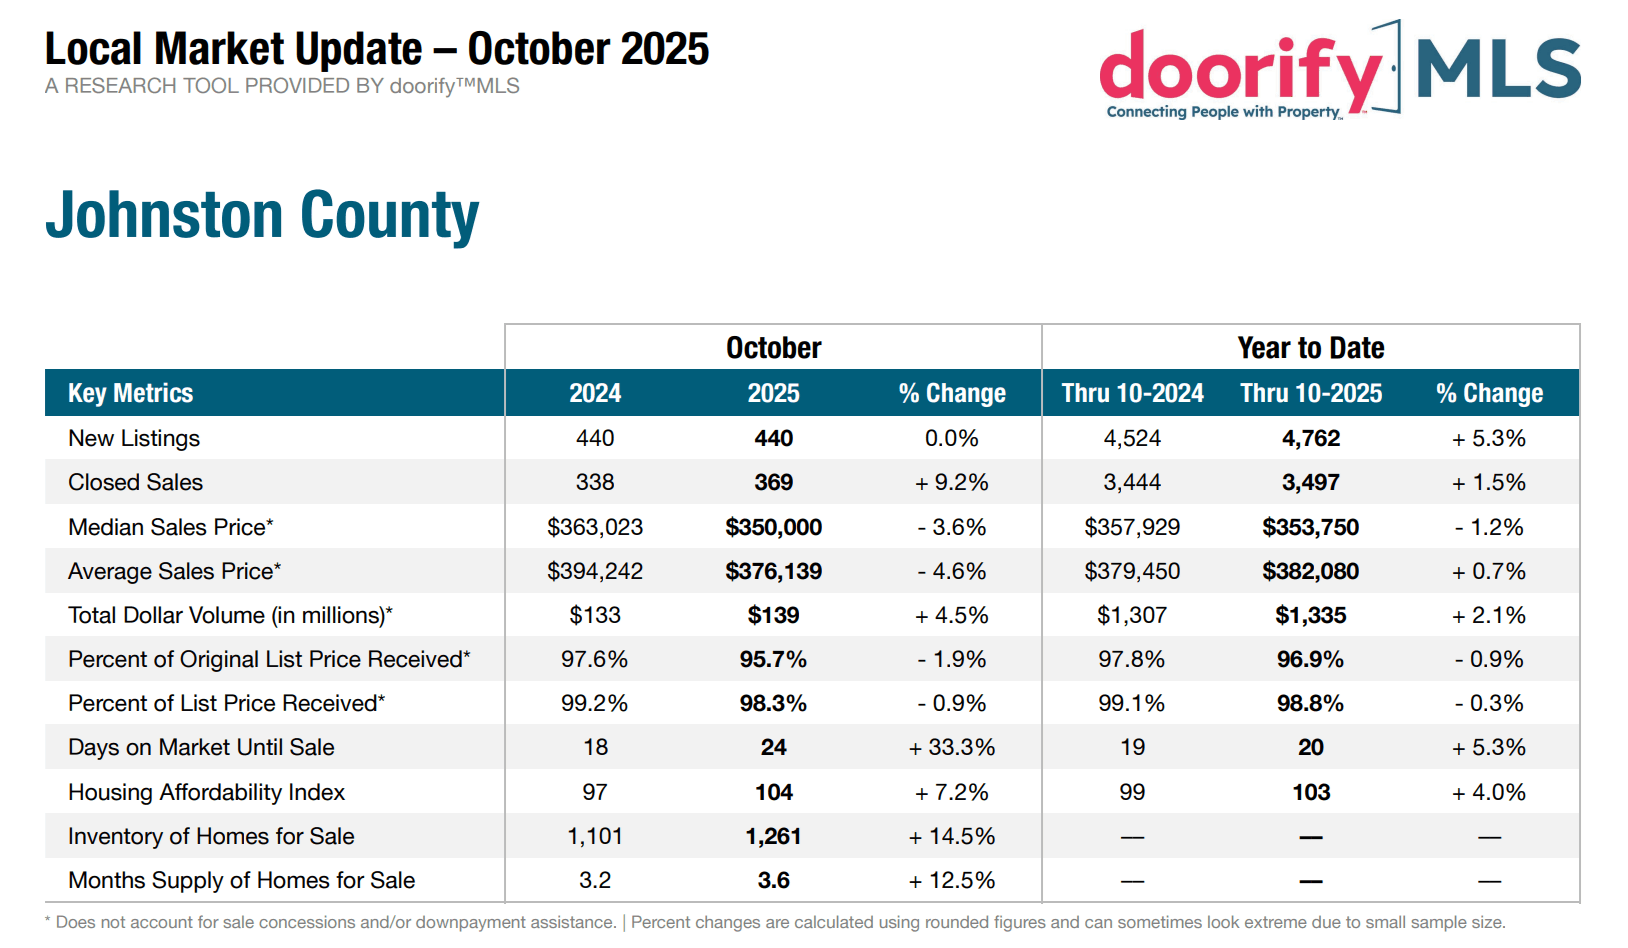
Homes are now taking close to three months to sell—longer than the 30–45 day window many saw earlier in the year.
Key takeaways:
Price strategically from day one. Overpricing leads to extended DOM and almost always ends in a price reduction.
Presentation matters more than ever. Staged, well-marketed homes continue to perform near list price, especially in high-demand areas like Apex, Knightdale, and Cary.
Condition counts. Buyers are more selective, and homes needing work are sitting longer.
What This Means for Buyers
The market is finally offering a bit more breathing room.
Here’s where opportunity opens up:
More options + stronger negotiation power.
Longer DOM often means sellers are more flexible.
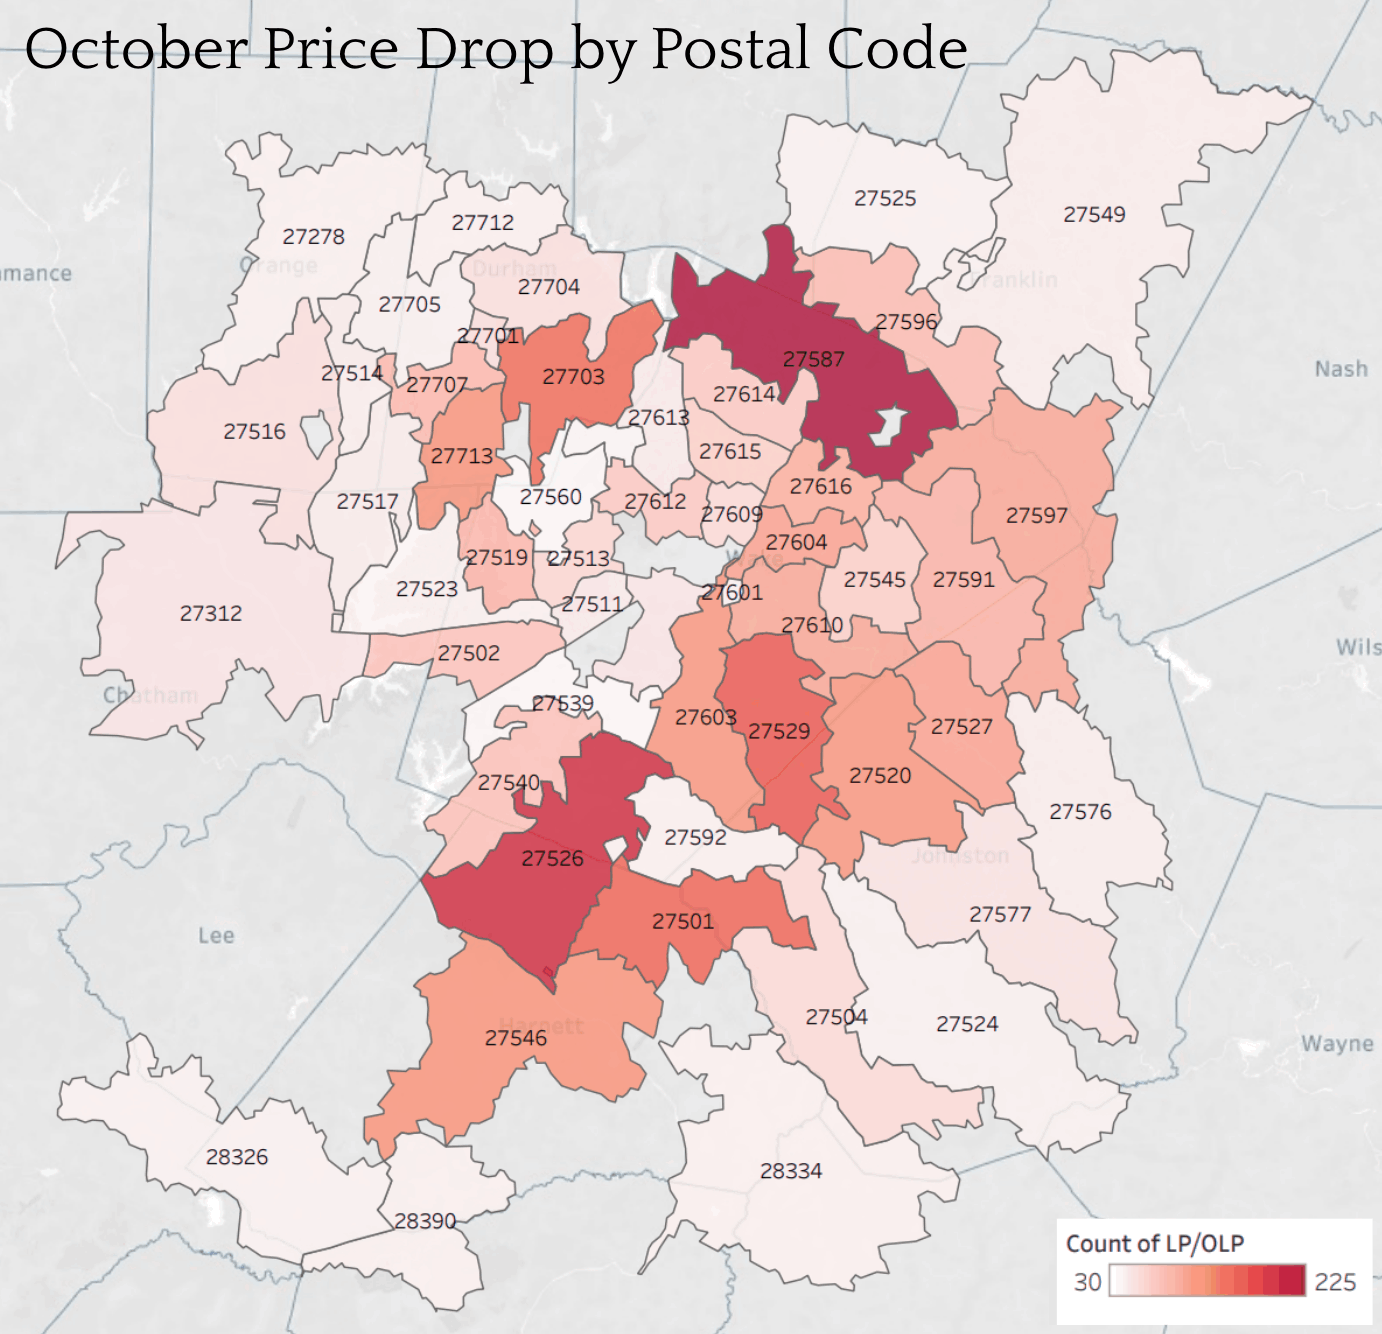
What Rising Price Drops Really Mean in Today’s Market
As price adjustments increase across the Triangle, the data is pointing toward a subtle shift: buyers are gaining negotiation power, and sellers are recalibrating after peak-season highs.
Why We’re Seeing More Price Drops
• A move toward balanced conditions.
Price reductions typically signal that buyers are pushing back on list prices while sellers adjust expectations from the rapid pace of spring and early summer.
• Seasonal slowdown is kicking in.
October historically ushers in a softer demand period following the busy summer months. A rise in price drops this time of year aligns with normal seasonal cooling—nothing alarming, but absolutely something to watch.
How to Use This Data Right Now
For Sellers
Set a competitive and realistic price from day one—especially in ZIP codes showing deeper red on the map. Overpricing is the fastest path to extended days on market, lower showing activity, and ultimately a forced price cut. A strategic launch prevents that spiral and attracts serious buyers early.
For Buyers
Focus your search on neighborhoods showing higher rates of price adjustments. These areas may offer more negotiating room, motivated sellers, or slightly reduced competition. It’s a smart moment to re-enter the market if you’ve been waiting for a bit more leverage.
Source: tarreport.com
Triangle Area Realidential Realty
Featured Neighborhoods


Sign Up for Our Quarterly Newsletter
Living Local Market Data - Local Insights - Mac Realty Giveaways - Events & More